An illustrative example of clustering
Imagine that we have data points in a two-dimensional space, as seen in Figure 11.11:
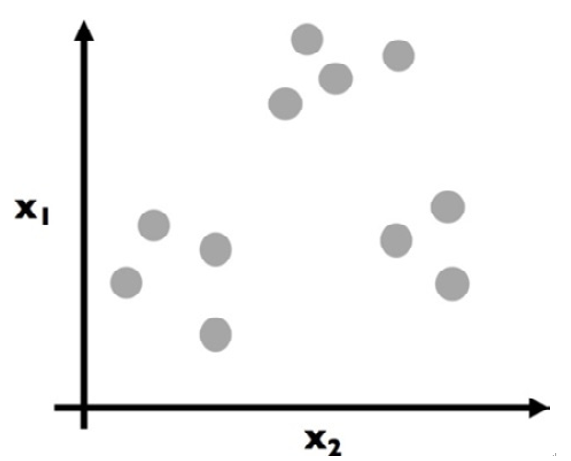
Figure 11.11 – A mock dataset to be clustered
Each dot is colored gray to assume no prior grouping before applying the k-means algorithm. The goal here is to eventually color in each dot and create groupings (clusters), as illustrated in Figure 11.12:
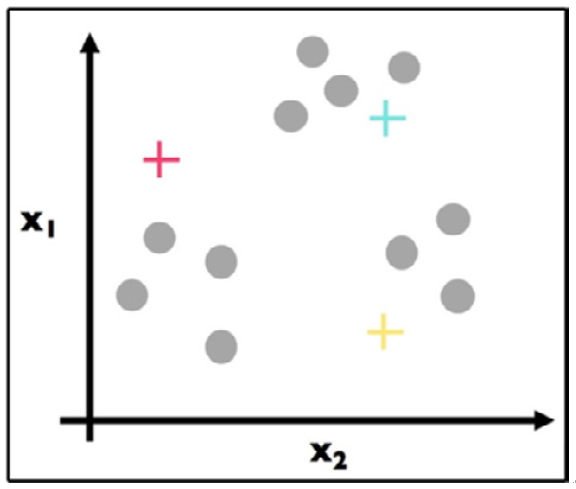
Figure 11.12 – Step 1: k-means clustering begins by placing random centroids
We have (randomly) chosen three centroids (red, blue, and yellow).
Important note
Most k-means algorithms place random initial centroids, but there exist other pre-computed methods to place initial centroids. For now, random is fine.
Step 2 has been applied in Figure 11.13. For each data point, we found the most similar centroid (closest):
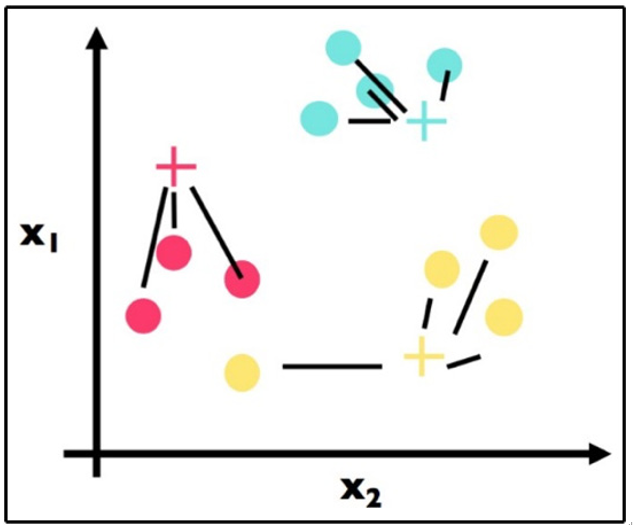
Figure 11.13 – Step 2: For each point, assign the point to the nearest centroid
We then apply step 3 in Figure 11.14:
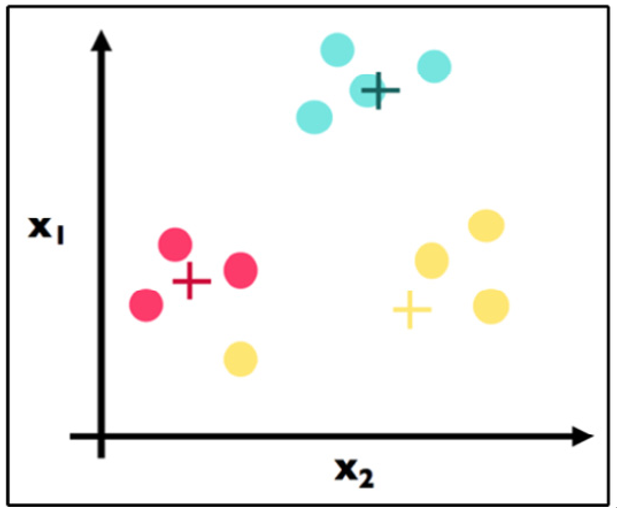
Figure 11.14 – Step 3: Recalculate the centroid positions
This is step 3 and the crux of k-means. Note that we have physically moved the centroids to be the actual center of each cluster. We have, for each color, computed the average point and made that point the new centroid. For example, suppose the three red data points had the following coordinates: (1, 3), (2, 5), and (3, 4). The center (red cross) would be calculated as follows:
# centroid calculation import numpy as np
red_point1 = np.array([1, 3]) red_point2 = np.array([2, 5]) red_point3 = np.array([3, 4])
red_center = (red_point1 + red_point2 + red_point3) / 3.
red_center
# array([ 2., 4.])
That is, the (2, 4) point would be the coordinates of the preceding red cross.
We continue with our algorithm by repeating step 2. Here is the first part where we find the closest center for each point. Note a big change – the point in the bottom left used to be a yellow point but has changed to be a red cluster point because the yellow cluster moved closer to its yellow constituents:
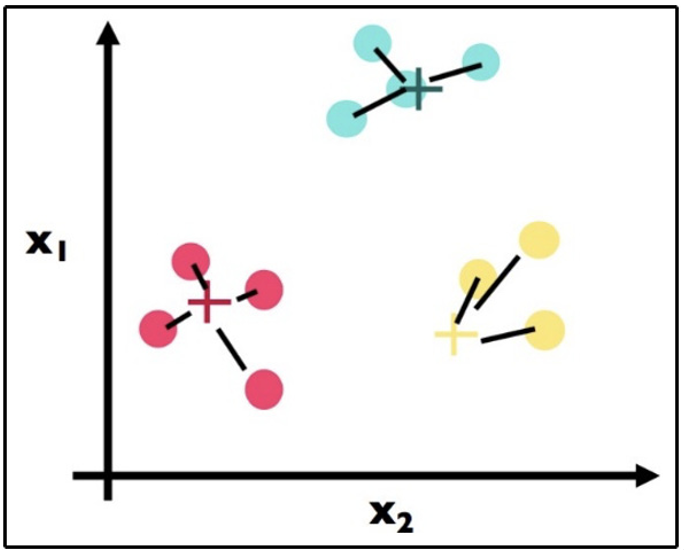
Figure 11.15 – Repeating step 2; note the data point on the lower left was yellow in the previous step and is now red
If we follow step 3 again, we get the result shown in Figure 11.16:
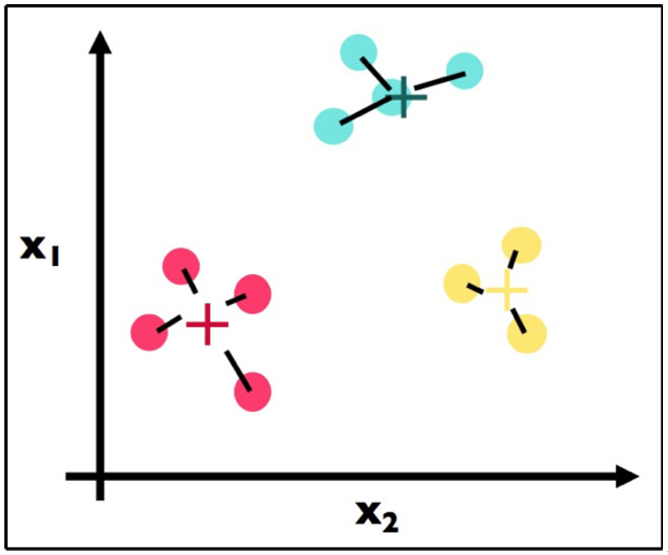
Figure 11.16 – Step 3 again
Here, we recalculate once more the centroids for each cluster (step 3). Note that the blue center did not move at all, while the yellow and red centers both moved.
Because we have reached a stopping criterion (clusters do not move if we repeat steps 2 and 3), we finalize our algorithm and we have our three clusters, which is the final result of the k-means algorithm.